Representing data using graphs: A sparse signal approximation view
Published:
Why do we need to represent data using graphs?
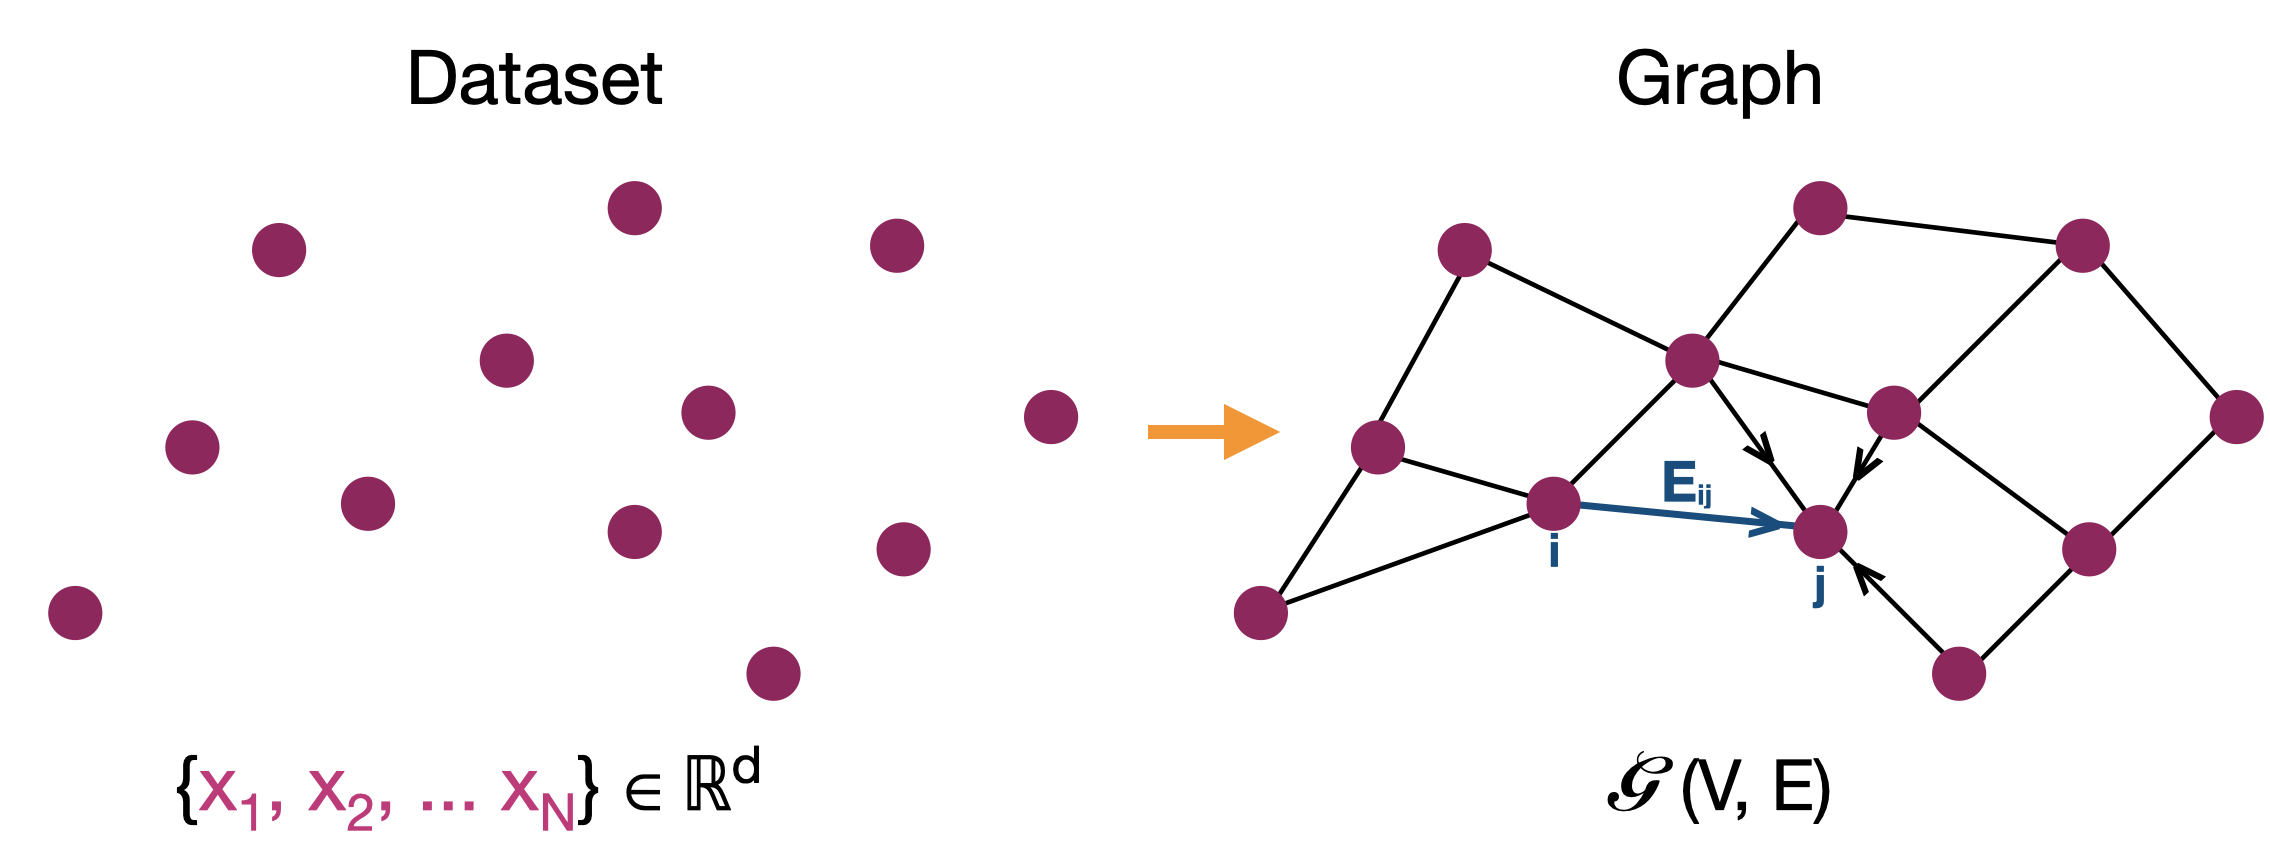
Graphs provide a generic setup to describe and analyze complex patterns in data where instead of observing data as isolated set of points, we can view them as network where data are entities/nodes with relationships/edges between them. Graph driven machine learning (Graph-ML) has seen a surge of interest in the recent years with several applications in social sciences, biology, and network analysis, to name a few. Unlike standard learning methods that learn a function to each data point (where locality and connectivity assumptions are implicit), graph-ML aims at leveraging explicitly the information across points to obtain better functions. Further, by associating graphs to data without labels or task specific details, one is able to use the data structure in semi-supervised and unsupervised learning scenarios.
A critical problem in the field of graph-ML is the definition of graph itself. In some scenarios, a graph structure is intuitive and at times given alongside the data. However, in most scenarios, no graph is given a’priori and one has to infer and construct a graph to fit the data and the task to be solved. In this post, I will mostly talk about working with weighted graphs, where the weights would represent degree of association/influence between two nodes.

In a typical graph learning problem, we are given N data points and the goal is to learn an efficient or sparse graph representation of the data. The key word here is efficient: An efficient graph can be defined as one with number of edges of the same order as the number of nodes. If not for efficiency, the problem can be trivially solved by connecting each data to every other data point with edge weights proportional to the distance/similarity between them. A sparse graph construction leads to faster downstream processing and allows for better understanding of the local neighborhood structure of the data.
Most popular graph construction methods to solve this problem are the k-nearest neighbor (KNN) and ∈-neighborhood graphs (∈-graph). In these methods, one connects each data point based on a predefined similarity metric to its k most similar neighbors or neighbors that are atleast ∈-similar to the data. However, the choice of parameters such as k and ∈, which explicitly define the sparsity and connectivity of the graph, are unknown and are often assigned values in an adhoc manner or via cross-validation leading to graphs that are not robust. Also, in cases it is not clear geometrically what the choice of these parameters amount to. In this post, I will try to convince you the sub-optimal nature of these standard methods and present possible improvements from a dictionary based data approximation perspective.
A primer on sparse signal approximation
Consider a collection of signals/functions that are unit normalized to form the building blocks to your signal space - we would refer to this set as a dictionary and its elements as atoms. A dictionary is complete when its atoms can represent the entire space of signals and is redundant when the atoms are linearly dependent i.e., one where an atom can be represented by a linear combination of the remaining atoms. In general, we often work with dictionaries that are redundant.
Sparse signal recovery or approximation involves finidng the simplest possible explanation of the signal using a linear combination of the atoms in the dictionary. The ability of a dictionary to provide a sparse representation for the signal depends on how well the signal matches the characteristics of the atoms in the dictionary. This problem is NP-hard in general and various relations and greedy approaches have been proposed in the past. A naive, basic approach to this problem is to find correlation between the signal and the atoms in the dictionary and use all those atoms that are within a threshold for the representation. A better approach, matching pursuit (MP), involves a greedy iterative selection procedure. This method works by finding the atoms that are maximally correlated to the residual (the part of the signal which is not represented) at each iteration until the signal is fully represented or no improvement can be made. This method does not guarantee optimality but works reasonably well for most real world appilcations and is easily better than thresholding. A second approach, orthogonal matching pursuit (OMP), works very similar to MP with one additional step at each iteration involving orthogonalization or reweighting of the contributions of atoms selected so far. Improved variations over these algorithms do exist and involve the ability to add groups of atoms at each step (instead of one per iteration) and pruning several of the atoms as redundant from the selection.
Graph construction as sparse signal approximation
KNN and ∈-neighborhood methods rely on a similarity measure obtained using a positive definite kernel (for e.g., Gaussian kernel) to select and weight the neighbors of a particular data point. These positive definite kernels corresponds to a transformation of data points to a possibly infinite dimensional space such that similarities are dot products in this transformed space. The dot product space associated with kernels are refferred to as Reproducing Kernel Hilbert Space (RKHS) has well established properties and applications but has not been sufficiently studied for the purpose of graph learning.
Under the distinction of data and transformed space (RKHS), for similarity kernels with maximum value 1, the inner product can be viewed as projection of one node on another i.e at a node i,

An additional detail unique to our problem setting is the non-negativity of the coefficients of approximation - the edge weights. To account for this, we will take into consideration the sign of correlation/projection of the atoms for our selection. Now, a k-nearest neighbor procedure (equivalently ∈-neighborhood) procedure at a node i can be reduced to the following steps
- Form a dictionary of atoms consisting of remaining data points.
- Select k atoms with maximum kernel similarity or correlation with data i
- Set to zero the contribution of remaining atoms not selected.
Thus, a KNN or ∈-graph framework is a signal approximation method obtained using a thresholding technique with thresholds set either globally (∈) or defined by desired sparsity (k). In the context of sparse dictionary based representation, it is well-known that selection via thresholding is suboptimal in general and is optimal only when the dictionary is not redundant. As discussed earlier, there exist a number of alternative methods that are better suited for the problem of sparse signal approximation such as MP and OMP. A straightforward adaptation of MP/OMP algorithm for graph construction at a node i can be obtained as below.
- Form a dictionary of atoms consisting of remaining data points.
- Let residue be the entire function corresponding to i initially.
- Select atoms with maximum positive correlation to the residue.
- Update residue as the approximation error in representing i with atoms selected.
- Repeat steps
2 - 4until approximation is exact or no atom exists with positive correlation.
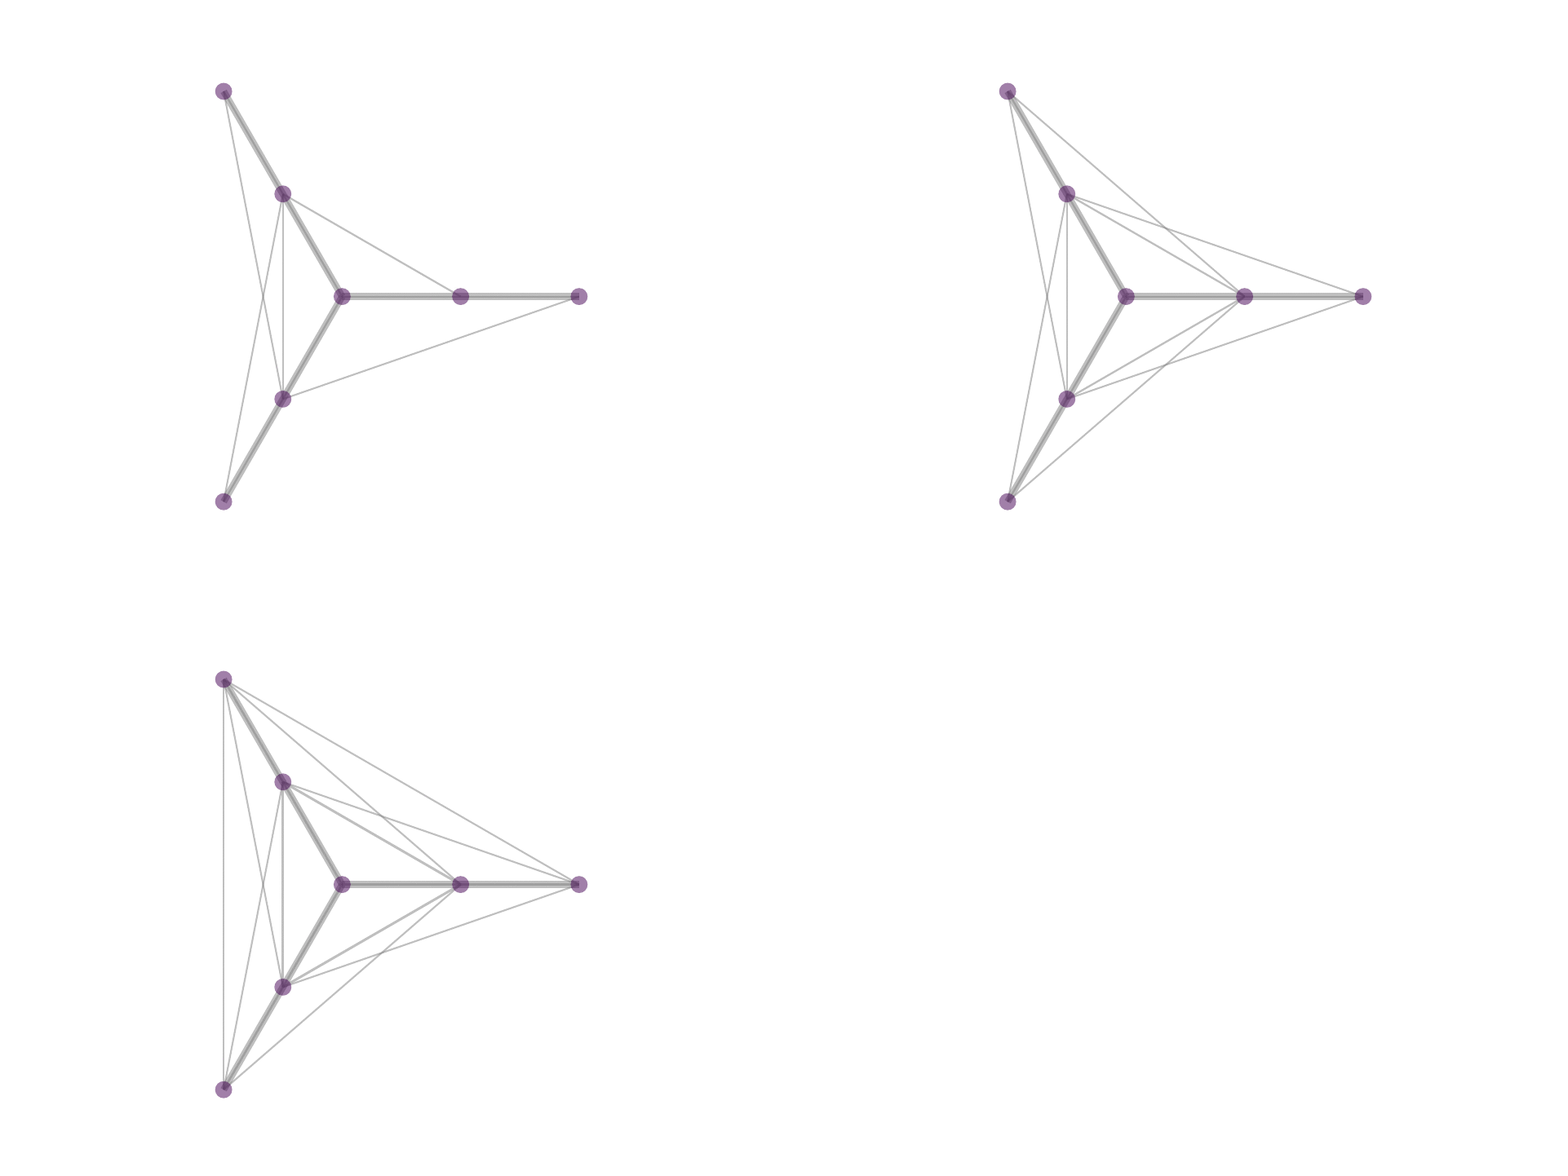
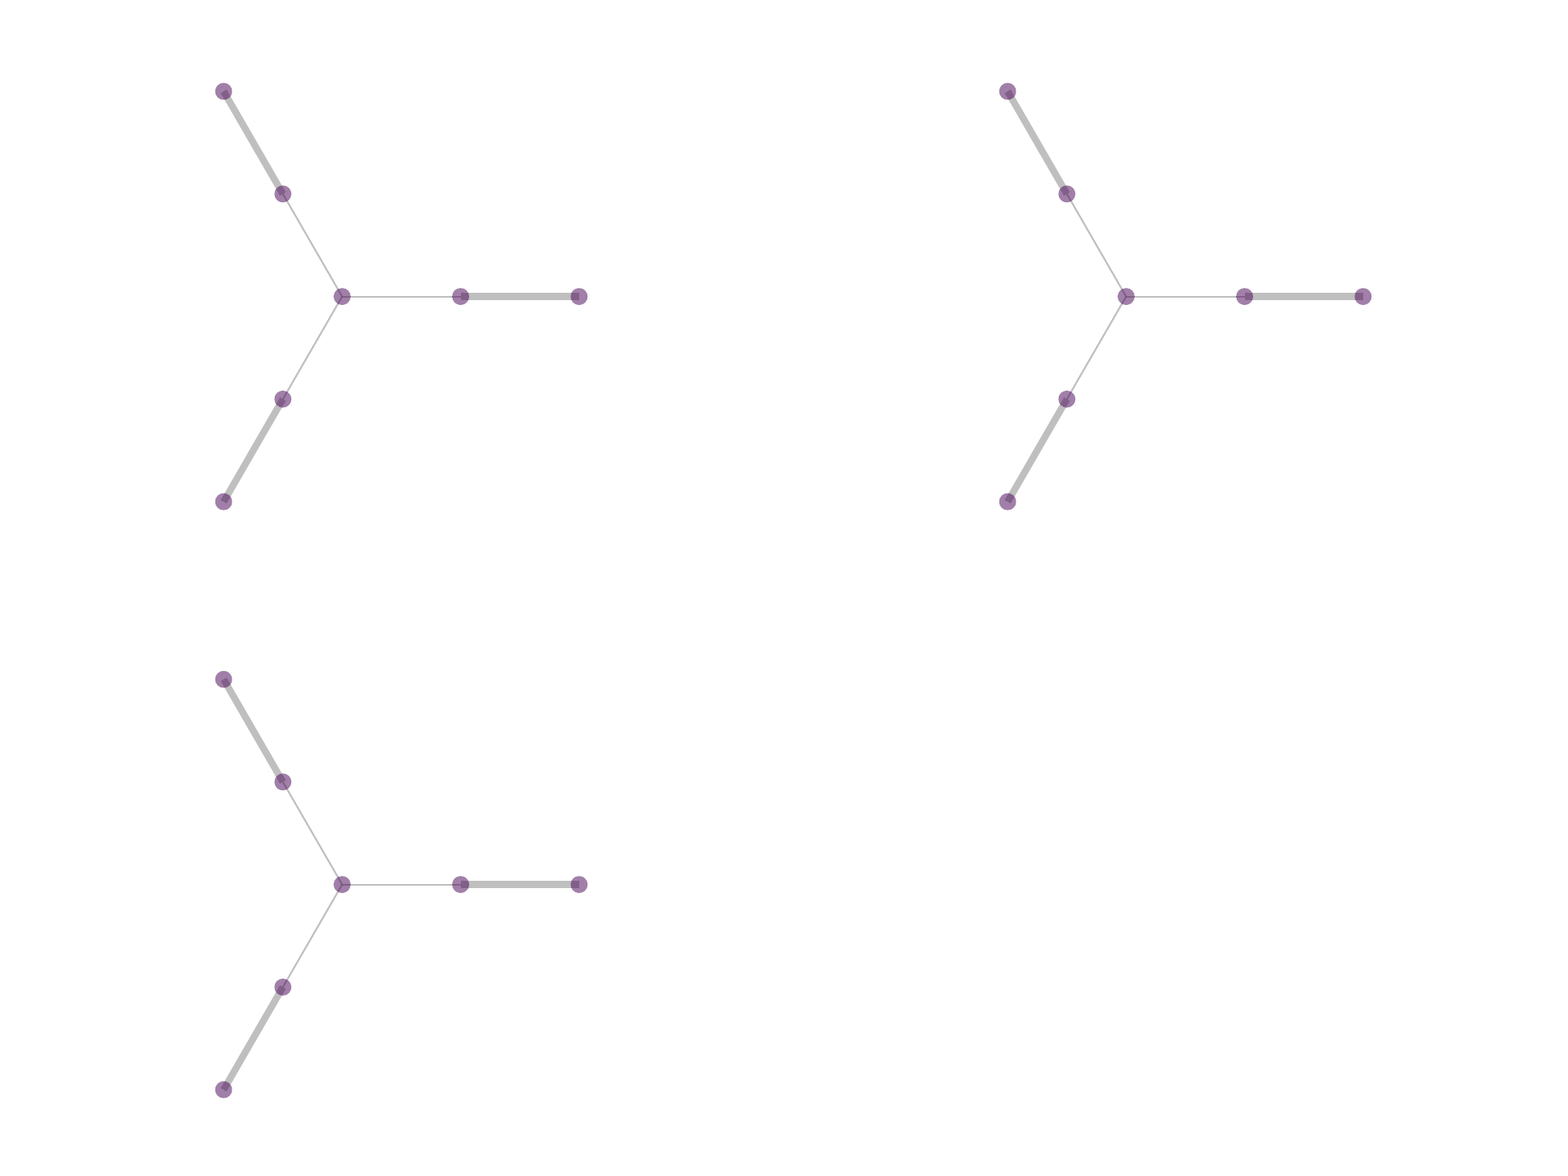
The difference between MP and OMP is at step 4 where, in MP one would use the correlation as weight for the atom selected in 3 while in OMP one performs least squared fit with all selected atoms to reweigh the contribution of the atoms selected. In reality, with the non negativity constrain one can obtain OMP like results by avoiding iterative selection and performing least squares fit on k-nearest neighbor or ∈-neighborhood selection in a single step optimization - a procedure that we proposed in NNK graphs. A key benefit of NNK graphs is its robustness to parameters such as k and ∈. This is because the number of neighbors that are assigned non-zero weights is not predetermined and instead depends on the local geometry of the data as in figure below.


Future Directions
In this post, we looked at a sparse signal approximation perspective to conventional graph and neighborhood construction methods with possible improvements from this perspective. The area of sparse signal approximation is vast - NNK graphs merely scratch the surface when it comes to incorporating this huge area with that of graph learning. Several possible improvements and ideas from dictionary based representation can be adapted such as
- How should one handle noise in the data and consequently dictionary used to construct the graphs?
- The discussion so far handles directed graphs. How should one perform symmetrization? Symmetrization allows for reasoning with several mathematical tools.
- Can we define kernel parameters based of dictionary learning methods?
Python and Matlab source code for NNK graph is available at github.com/STAC-USC/
